Surfing the web and scrolling through twitter, you are blown away by the sheer volume of lists: the top 5 tips for startups, 30 best social media tricks, 20 questions with this expert, 10 lessons from that expert or the 8 newest technology trends. Some are interesting to scroll through, others you forget in a second. But the fact remains, it is an appealing way to present information and increase traffic to your site. You are triggered to get inspired or to see whether you agree with the rankings. Or, perhaps, you or your sector is featured in one list and you could use it for extra publicity. Articles that provide advice on how to write blog posts stimulate the ‘list’ manner of writing. And your Google SEO just loves it.
The position of a country, city, company or person is a favorable victim to spotlight in a list. We have the established watchdogs, such as Forbes 500, Time 100 and the United Nations Human Development Index. From a macro innovation perspective, we start with having a look at the Global innovation Index and Innovation Union Scoreboard. In the field of Startups, we might have a look at the Startup Ecosystem Report. For technology, the Global Information Technology report or the 12 disruptive technologies are a good start. However, more and more, every self-enhancing media platform launches its own list. Some do so with success, some fail. How do we find our way through all of these rankings? Other than having a look at the source, the way the material is presented is often the best indicator.
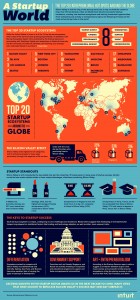
The newest trend in list tsunami is the infographic: also known as the visual power. Instead of just words, a combination of letters and pictures are combined to communicate the message. An additional advantage of this method is the ability to show the time span, ties and connections between topics. A general recognized one is the infographic of ten years of influence; providing you with the name, the achievement and the field of work. But also the up and coming self-made rankings shift to this presentation format. Entrepreneur magazine published a rather small article on the worlds 20 hottest startup cities [unfortunately, Barcelona is not quite large enough yet] based on the Startup Genome Ecosystem Report. Their added value is the infographic. Have a look.
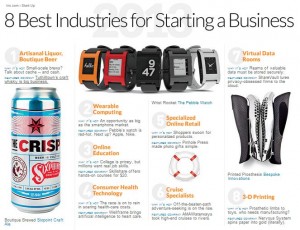
Looking for new business development opportunities? On Inc. (the kings of the list makers) they made a nice infographic, which you should put on your wall covering the 8 promising industries to start a business. In one line it describes why this specific industry is hot and an example company is featured. If you want to know more about it, you could read the underlying in-depth articles.
Still hungry for more lists? Have a look at the Top 50 Innovation tweeters in 2013. Follow them, but be careful not to drown in all the lists, rankings and indexes.
Image credits: Entrepreneur and Inc.


Leave a Reply